At the June Governing Board Meeting, the board received a year update on progress toward achieving all four Academic Goals.
AASA Data
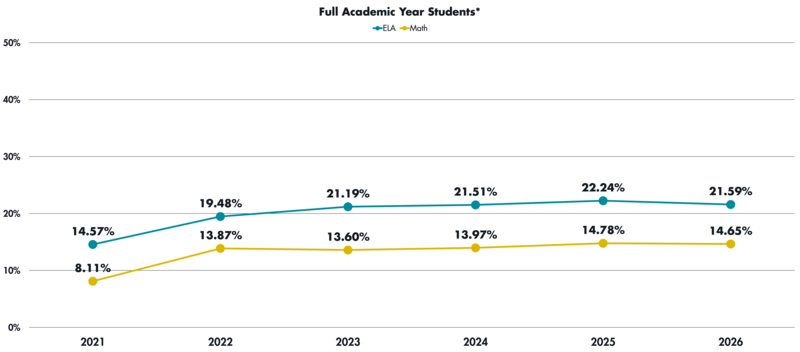
Full Academic Year Student Proficiency
After approximately a five-point increase in ELA and Math proficiency from 2021 to 2022, AASA proficiency has remained at a consistent level, with 21.59% and 14.65% of full-academic-year students, respectively, achieving proficiency on this year's exams.
ELA Proficiency
3rd-8th Grade Students
2023 | 2024 | 2025 | 2026 | |
|---|---|---|---|---|
3rd | 18% | 21% | 20% | 17% |
4th | 21% | 20% | 25% | 23% |
5th | 14% | 16% | 13% | 18% |
6th | 21% | 21% | 23% | 21% |
7th | 22% | 22% | 27% | 26% |
8th | 23% | 19% | 27% | 25% |
By Population
2023 | 2024 | 2025 | 2026 | |
|---|---|---|---|---|
Black | 17.2% | 19.3% | 20.9% | 19.0% |
Hispanic | 20.3% | 19.8% | 22.6% | 21.7% |
ESS | 3.0% | 2.7% | 4.9% | 5.2% |
English Learner | 3.9% | 4.7% | 3.9% | 2.9% |
Math Proficiency
3rd-8th Grade
2023 | 2024 | 2025 | 2026 | |
|---|---|---|---|---|
3rd | 17% | 22% | 22% | 17% |
4th | 12% | 11% | 16% | 17% |
5th | 10% | 10% | 14% | 16% |
6th | 12% | 9% | 12% | 13% |
7th | 12% | 11% | 12% | 11% |
8th | 12% | 13% | 13% | 16% |
By Population
2023 | 2024 | 2025 | 2026 | |
|---|---|---|---|---|
Black | 9.7% | 10.9% | 11.5% | 11.5% |
Hispanic | 13.0% | 11.3% | 15.3% | 14.8% |
ESS | 2.8% | 2.9% | 5.8% | 4.5% |
English Learner | 3.4% | 4.3% | 5.4% | 4.0% |
STAR Data
Reading
2nd-8th Grade
Aug. | Dec. | May | |
|---|---|---|---|
2nd | 28.3% | 31.5% | 29.5% |
3rd | 24.0% | 23.5% | 23.4% |
4th | 25.7% | 24.7% | 21.9% |
5th | 25.1% | 24.7% | 23.6% |
6th | 16.4% | 15.6% | 19.1% |
7th | 22.3% | 21.7% | 26.5% |
8th | 14.1% | 15.2% | 16.9% |
By Population
Population | Students | Proficient | Percentage | Growth Avg. |
|---|---|---|---|---|
Black | 690 | 140 | 20.3% | 46 |
Hispanic | 4,295 | 979 | 22.8% | 46 |
ESS | 821 | 40 | 4.9% | 41 |
English Learner | 1,176 | 26 | 2.2% | 42 |
Female | 2,651 | 615 | 23.2% | 46 |
Male | 2,739 | 619 | 22.6% | 47 |
District Total | 5,391 | 1,233 | 22.9% | 46 |
Math
1st-8th Grade
Aug. | Dec. | May | |
|---|---|---|---|
1st | 29.9% | 41.4% | 37.7% |
2nd | 29.6% | 26.7% | 26.9% |
3rd | 24.5% | 25.8% | 27.4% |
4th | 25.7% | 23.2% | 23.0% |
5th | 23.1% | 25.1% | 19.3% |
6th | 12.6% | 12.6% | 15.4% |
7th | 14.2% | 14.9% | 14.2% |
8th | 9.8% | 8.5% | 11.4% |
By population
Population | Students | Proficient | Percent | Growth Avg. |
|---|---|---|---|---|
Black | 796 | 147 | 18.5% | 41 |
Hispanic | 4,827 | 1,050 | 21.8% | 41 |
ESS | 917 | 64 | 7% | 35 |
English Learner | 1,357 | 83 | 6.1% | 38 |
Female | 3,004 | 554 | 18.4% | 40 |
Male | 3,077 | 752 | 24.8% | 41 |
District Total | 5,994 | 1,298 | 21.7% | 41 |
Summer Learning 2026
Principals Summit: June 1–5
Reflection on the 2025–26 school year
Goal-setting and implementation planning for 2026–27
Leadership development
Admin Academy: July 13–17
All schools' Instructional Leadership Team
Professional learning to support goals and priorities
Summer Institute: July 23–24
All teachers
Professional learning aligned to district goals and priorities
"Common message" and role-specific sessions