At the March Governing Board meeting, the Board received an update on progress toward achieving Academic Goal #2 and interim goals 2.1 and 2.2.
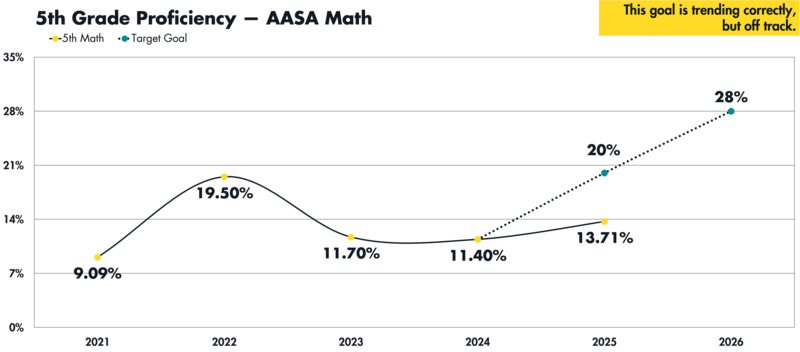
Fifth Grade AASA Math Proficiency
Academic Goal #2
The percent of fifth-grade students who score at Proficiency or higher on AASA Math will increase from 11% in Aug. 2023 to 45% by Aug. 2028.
This goal is trending correctly, but off track.
Fifth graders showed a modest increase in proficiency from the previous fifth-grade cohort on AASA Math. This goal is still off-track according to AASA and Star Math results, even with slight improvements in math proficiency in grades 3-5.
Third Grade STAR Math Proficiency
January 2026 Progress Monitoring By School
School | Students | Minimally Proficient | Percent | Partially | Combined | Percent |
Bernard Black | 64 | 51.6% | ↓ 16.1 | 32.8% | 15.7% | ↑ 1.4 |
C.C. Campbell | 39 | 46.2% | ↓ 10.6 | 17.9% | 35.9% | ↑ 3.4 |
C.E. Chavez | 48 | 58.3% | ↑ 1.5 | 18.8% | 22.9% | ↑ 5.3 |
E.V. Pastor | 57 | 40.4% | ↑ 0.3 | 29.8% | 29.8% | ↓ 2.2 |
Ignacio Conchos | 63 | 58.7% | ↓ 9.5 | 20.6% | 20.6% | ↑ 1.3 |
Irene Lopez | 46 | 58.7% | ↑ 9.7 | 26.1% | 15.2% | ↓ 8.2 |
J.F. Kennedy | 84 | 52.4% | ↑ 7.2 | 23.8% | 23.9% | ↓ 5.9 |
P.L. Julian | 54 | 44.4% | ↓ 12.7 | 18.5% | 37.1% | ↑ 9.1 |
Southwest | 39 | 48.7% | ↓ 6.6 | 30.8% | 20.5% | ↓ 7.3 |
Sunland | 79 | 67.1% | ↓ 2.4 | 15.2% | 17.8% | ↓ 0.8 |
T.G. Barr | 29 | 55.2% | ↑ 3.5 | 24.1% | 20.6% | ↓ 3.4 |
Valley View | 66 | 53.0% | ↑ 0.7 | 22.7% | 24.2% | ↓ 9.1 |
District | 668 | 53.5% | ↓ 1.8 | 23.2% | 23.4% |
|
Third Grade STAR Math Proficiency
Interim Goal #2.1
The percentage of students performing at Proficiency or Higher on the third-grade STAR Math Assessment will increase from 29.8% to 36% by May 2026.
This interim goal is off track.
At the start of the school year, third-grade students were performing at 24.5% proficiency on the assessment. At the time of the October benchmark testing, they were performing at 23.4% proficiency. They are not currently expected to achieve the 36% goal set for May 2026.
Interim Goal #2.2
The percentage of students performing at minimally proficient on the third-grade STAR Math Assessment will decrease from 48.8% to 40% by May 2026.
This interim goal is trending correctly, but off track.
At the start of the school year, third-grade students were performing at 55.3% minimal proficiency on the assessment. At the time of the October benchmark testing, they showed improvement to 53.5% minimal proficiency. While encouraging, they are not currently expected to achieve the 40% goal set for May 2026.
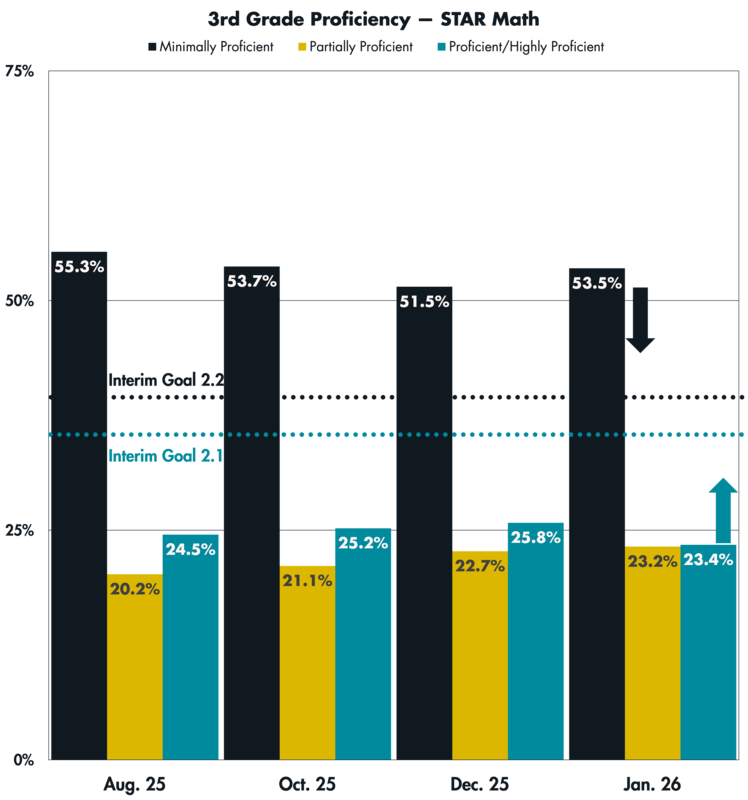
The teal arrow indicates our interim goal of reducing minimally proficient students to below the teal dotted line, and the black arrow indicates increasing proficient students to above the black dotted line.
Key Inputs
Learning Walk Data
Strengths we can build on
Clear focus on planning for rigor
Most action steps emphasize Internalization (Rigor #3) and Academic Monitoring (Rigor #6)—the right drivers for tighter lessons and in‑the‑moment responsiveness.
Modeling & clarity of steps are common
85% of math visits included modeling components (clear steps, exemplars, metacognition) and 72% had tasks aligned to the learning target—good signals for clarity and alignment.
Student engagement is generally high
Average engagement across math rooms is around 80%; K, 1–2, and 3–5 bands run in the 83–87%. This can be directly correlated to strong classroom management practices and implementation of MTSS-B structures and practices.
Gaps to close
Success Criteria in action
Only 14% of math lessons explicitly referenced success criteria; just 18% provided feedback aligned to the SC during circulation. This constrains corrective pivots and student self-monitoring.
Exit tickets/CFUs aren’t routine
42% of math lessons used an exit ticket; the rate drops to 31% in Grades 6–8.
Student discourse is limited
Turn‑and‑Talk/structured discourse occurred in 21% of math visits (highest in 3–5 at 29%, far lower elsewhere).
Productive struggle is uneven
Only 40% of math tasks required productive struggle; 6–8 is lowest (31%)
Professional Development Opportunities
K-5 Math
Date | Topic |
Sept. 18, 2025 | Documentation of Learning |
Oct. 23, 2025 | Vocabulary Building & Language Scaffolding (Math/EL) |
Nov. 10, 2025 | Zooming in to Questioning Strategies |
Nov. 17, 2025 | Zooming in to Questioning Strategies (repeat) |
Dec. 11, 2025 | Target/Task/Assessment Alignment |
Jan. 22, 2026 | Planning for Small Groups (Math K-8) |
Jan. 24, 2026 | MEAD Conference 20226 (Tucson/Online) |
Feb. 9, 2026 | Zoom in to Math Rigor (K-5) |
Feb. 17, 2026 | Zoom in to Math Rigor (K-5) – repeat |
Feb. 26, 2026 | Productive Struggle in Science and Math (K-8) |
March 26, 2026 | Discourse in Science and Math (K-8) |
April 28, 2026 | Geometry and Measurement: Foundational Concepts (K-5) |
5-8 Departmentalized Math
Date | Topic |
Aug. 27, 2025 | Departmentalized 5th Grade Math PLT |
6-8 Math PLT | |
Sept. 18, 2025 | Modeling with Student Notetaking Strategies |
Sept. 24, 2025 | Departmentalized 5th Grade Math PLT |
6-8 Creating Assessments in Pear | |
Oct. 23, 2025 | K-8 Vocabulary Building and Language Scaffolding (Math/EL) |
Oct. 29, 2025 | Effective MATHia Implementation |
Nov. 10, 2025 | Carnegie Lesson Planning |
Dec. 6, 2025 | Using IXL as a Supplemental Resource for 6th-8th Grade Math |
Dec. 11, 2025 | K-8 Target/Task/Assessment Alignment |
Dec. 18, 2025 | Carnegie Lesson Planning Part 2 |
Jan. 22, 2026 | Planning for Small Groups (Math K-8) |
Feb. 26, 2026 | Productive Struggle in Math and Science (K-8) |
March 26, 2026 | Discourse in Science and Math (K-8) |
PLT Protocols and Practices
Weekly Planning Meetings
Weekly Data Meetings
WDM Data Trackers – Math (3rd and 6th grade prioritized)
Standard/Skill: 1/20 3.OA.D.8 Learning Target: I can solve two-step word problems using all operations | ||||
|---|---|---|---|---|
Week 2 | Gap Statement | Type of Research | Reteach Date | |
% Mastery for Standard before reteach | % Mastery for Standard post reteach | Students are not yet able to solve two-step word problems because they do not understand how to break the problem into two parts. They also truly don’t understand what the problem is asking them to do (add, subtract, multiply, divide). | Model | 1/28 |
14% | 37% | |||
14% | 37% | |||
District-Wide Targeted Math Tutoring
Format
9 Weeks – January through March (3 days/week)
Lesson Structure
Fact Fluency (5 minutes)
Multi-Step Word Problems (15 minutes)
Rotations (20 min each)
IXL – individual needs
Teacher-led AASA Practice Problems
End-of-Week Exit Ticket (5 min)
Student Impact
2nd Grade: 8
3rd Grade: 86
5th Grade: 86
6th Grade: 71
8th Grade: 52
K12 Coalition: Math Program Improvement
Phase 1: Baseline Analysis
Comprehensive review of curriculum, assessments, data, and classroom observations
Phase 2: Gap Analysis & Synthesis
Synthesize evidence to create a current picture of mathematics in RSD and identify gaps, strengths, and opportunities
Phase 3: Reporting & Recommendations
Data-rich report with prioritized recommendations, refinements, and strategic actions
Phase 4: Implementation Planning
Collaboratively design professional development plans, tools and systems for improvement