At the April Governing Board meeting, the Board received an update on progress toward achieving interim goals 1.1, 1.2 and 1.3.
Fourth Grade AASA ELA Proficiency
Academic Goal #1
The percent of fourth-grade students who score at Proficiency or higher on AASA ELA will increase from 20% on Aug. 2023 to 45% by Aug. 2028.
This goal is trending correctly, but off track.
Fourth-grade ELA improved on AASA, rising from 21.7% in 2024 to 24.9% in 2025. However, the Student Growth Percentile average for 4th grade was relatively low (45.5). Similar to Goal 3, ELA is making proficiency gains but will need to achieve greater academic gains to meet this year’s target of 33%.
STAR Early Literacy Proficiency
Full Academic Year Benchmark Assessment By School
Kindergarten
School | Aug. Urgent Intervention | Jan. Urgent Intervention | Aug. Intervention | Jan. Intervention | Aug. On Watch | Jan. On Watch | Aug. At/Above Benchmark | Jan. At/Above Benchmark | Percent Change |
|---|---|---|---|---|---|---|---|---|---|
Bernard Black | 15.7% | 15.7% | 21.6% | 17.6% | 29.4% | 19.6% | 33.3% | 47.1% | ↑13.8 |
C.C. Campbell | 25.0% | 20.8% | 37.5% | 20.8% | 14.6% | 16.7% | 22.9% | 41.7% | ↑18.8 |
C.E. Chavez | 46.4% | 21.4% | 25.0% | 10.7% | 10.7% | 17.9% | 17.9% | 50.0% | ↑32.1 |
E.V. Pastor | 36.6% | 9.8% | 31.7% | 12.2% | 12.2% | 19.5% | 19.5% | 58.5% | ↑39 |
Ignacio Conchos | 30.3% | 12.1% | 27.3% | 18.2% | 12.1% | 21.2% | 30.3% | 48.5% | ↑18.2 |
Irene Lopez | 46.4% | 3.6% | 35.7% | 10.7% | 10.7% | 7.1% | 7.1% | 78.6% | ↑71.5 |
J.F. Kennedy | 42.1% | 27.6% | 32.9% | 15.8% | 9.2% | 15.8% | 15.8% | 40.8% | ↑25 |
P.L. Julian | 35.5% | 19.4% | 19.4% | 12.9% | 16.1% | 25.8% | 29.0% | 41.9% | ↑12.9 |
Southwest | 62.5% | 12.5% | 12.5% | 0.0% | 6.2% | 9.4% | 18.8% | 78.1% | ↑59.3 |
Sunland | 41.2% | 38.2% | 29.4% | 8.8% | 10.3% | 23.5% | 19.1% | 29.4% | ↑10.3 |
T.G. Barr | 37.9% | 3.4% | 27.6% | 6.9% | 17.2% | 27.6% | 17.2% | 62.1% | ↑44.9 |
Valley View | 22.6% | 5.7% | 26.4% | 13.2% | 24.5% | 3.8% | 26.4% | 77.4% | ↑51 |
District | 35.7% | 18.1% | 28.0% | 12.9% | 14.7% | 17.2% | 21.6% | 51.7% | ↑30.1 |
First Grade
School | Aug. Urgent Intervention | Jan. Urgent Intervention | Aug. Intervention | Jan. Intervention | Aug. On Watch | Jan. On Watch | Aug. At/Above Benchmark | Jan. At/Above Benchmark | Percent Change |
|---|---|---|---|---|---|---|---|---|---|
Bernard Black | 25.6% | 27.9% | 14.0% | 25.6% | 25.6% | 11.6% | 34.9% | 34.9% | 0 |
C.C. Campbell | 17.1% | 14.6% | 17.1% | 22.0% | 14.6% | 9.8% | 51.2% | 53.7% | ↑ 2.5 |
C.E. Chavez | 25.6% | 41.0% | 33.3% | 12.8% | 5.1% | 12.8% | 35.9% | 33.3% | ↓ -2.6 |
E.V. Pastor | 15.5% | 12.1% | 17.2% | 31.0% | 25.9% | 15.5% | 41.4% | 41.4% | 0 |
Ignacio Conchos | 27.1% | 13.6% | 18.6% | 32.2% | 16.9% | 16.9% | 37.3% | 37.3% | 0 |
Irene Lopez | 20.5% | 13.6% | 22.7% | 22.7% | 18.2% | 22.7% | 38.6% | 40.9% | ↑ 2.3 |
J.F. Kennedy | 24.1% | 26.4% | 26.4% | 23.0% | 27.6% | 16.1% | 21.8% | 34.5% | ↑ 12.7 |
P.L. Julian | 22.9% | 20.8% | 12.5% | 27.1% | 18.8% | 14.6% | 45.8% | 37.5% | ↓ -8.3 |
Southwest | 14.6% | 17.1% | 31.7% | 26.8% | 17.1% | 31.7% | 36.6% | 24.4% | ↓ -12.2 |
Sunland | 32.9% | 17.1% | 19.5% | 23.2% | 15.9% | 15.9% | 31.7% | 43.9% | ↑ 12.2 |
T.G. Barr | 23.8% | 21.4% | 14.3% | 35.7% | 19.0% | 11.9% | 42.9% | 31.0% | ↓ -11.9 |
Valley View | 9.4% | 12.5% | 12.5% | 18.8% | 26.6% | 25.0% | 51.6% | 43.8% | ↓ -7.8 |
District | 22% | 19.6% | 19.9% | 25% | 20.2% | 17.1% | 37.9% | 38.4% | ↑ 0.5 |
Interim Goal #1.1
The percentage of second-grade students reading at or above 76 words per minute will increase from 56% to 70% by the end of the year, as measured by the Star Oral Reading Fluency Assessment on a Grade 2 Passage.
This goal is trending correctly, but off track.
At the start of the school year, 41% of second-grade students were performing at or near benchmark on the assessment. At the time of the December benchmark testing, 49% of students were at or near the benchmark. While there has been marked growth, they are not expected to achieve 70% of students at or above 76 words per minute by May 2026.
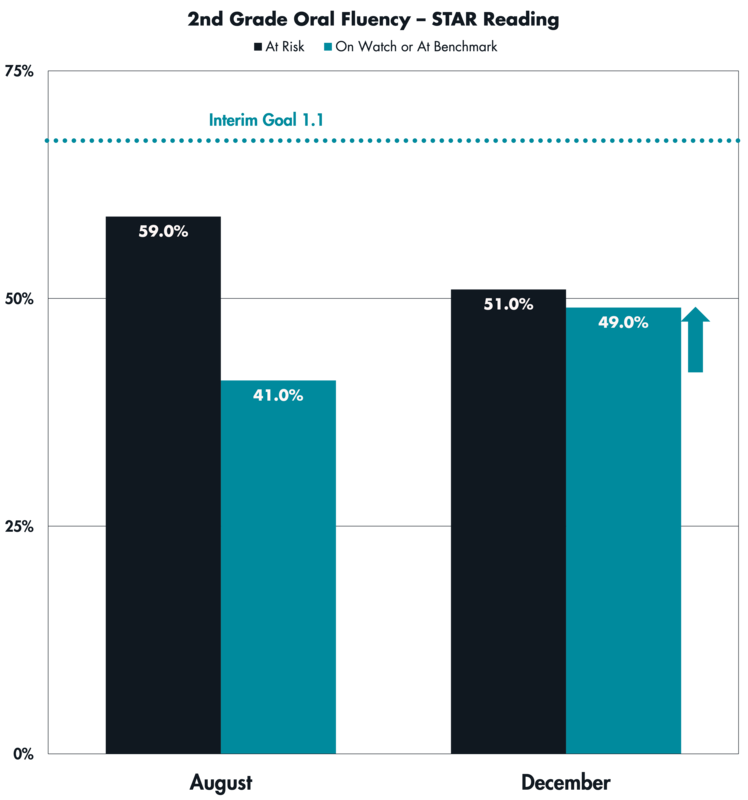
The teal arrow indicates our interim goal of increasing proficient students to the teal dotted line.
Median Words Correct Per Minute by Assessment Window
School | August WCPM | September WCPM | November WCPM | December WCPM | February WCPM | Aug. to Feb. Change | Percent Change |
|---|---|---|---|---|---|---|---|
Bernard Black | 68 | 69 | 84.5 | 89 | 100 | 32 | 47.06% |
C.C. Campbell | 32 | 50 | 58.5 | 65 | 78 | 46 | 143.75% |
C.E. Chavez | 24 | 25 | 53 | 59 | 60 | 36 | 150.00% |
E.V. Pastor | 46 | 48 | 73.5 | 63 | 83 | 37 | 80.43% |
Ignacio Conchos | 64 | 90 | 81.5 | 87 | 95.5 | 31.5 | 49.22% |
Irene Lopez | 33 | 38.5 | 42 | 50 | 65 | 32 | 96.97% |
J.F. Kennedy | 45.5 | 63 | 71 | 79.5 | 78 | 32.5 | 71.43% |
P.L. Julian | 39.5 | 57 | 73 | 70 | 83 | 43.5 | 110.13% |
Southwest | 26 | 39 | 52.5 | 59.5 | 75 | 49 | 188.46% |
Sunland | 27.5 | 38 | 41 | 57 | 68 | 40.5 | 147.27% |
T.G. Barr | 36 | 41 | 46 | 66 | 69 | 33 | 91.67% |
Valley View | 63 | 71 | 88 | 101.5 | 91 | 28 | 44.44% |
District | 40 | 52 | 64 | 70 | 80 | 40 | 100% |
2nd Grade STAR Reading Proficiency
January Full Academic Year Progress Monitoring By School
School | Students Tested | Minimally Proficient | Percent Change | Partially Proficient | Combined Proficiency | Percent Change |
|---|---|---|---|---|---|---|
Bernard Black | 43 | 55.8% | ↓ 4.7 | 4.7% | 39.5% | ↑ 4.6 |
C.C. Campbell | 51 | 54.9% | ↓ 9.8 | 11.8% | 33.3% | ↑ 3.9 |
C.E. Chavez | 47 | 80.9% | 0.0 | 6.4% | 12.8% | ↓ 6.3 |
E.V. Pastor | 42 | 61.9% | ↑ 7.1 | 4.8% | 33.3% | ↓ 4.8 |
Ignacio Conchos | 43 | 67.4% | ↑ 4.6 | 4.7% | 27.9% | ↑ 4.6 |
Irene Lopez | 49 | 65.3% | ↓ 8.2 | 12.2% | 22.5% | ↑ 8.2 |
J.F. Kennedy | 73 | 56.2% | ↑ 2.8 | 8.2% | 35.6% | ↓ 1.4 |
P.L. Julian | 50 | 66.0% | ↑ 6.0 | 4.0% | 30.0% | ↓ 2 |
Southwest | 40 | 45.0% | ↓ 15.0 | 17.5% | 37.5% | ↑ 12.5 |
Sunland | 83 | 75.9% | ↑ 7.2 | 4.8% | 19.3% | ↓ 7.2 |
T.G. Barr | 37 | 64.9% | ↑ 2.7 | 10.8% | 24.3% | ↓ 2.7 |
Valley View | 49 | 38.8% | ↓ 6.1 | 6.1% | 55.1% | ↑ 8.1 |
District | 607 | 61.8% | ↓ 0.5 | 7.70% | 30.4% | ↑ 0.7 |
Interim Goal #1.2
The percentage of students performing at Proficiency or Higher on the second-grade STAR Reading Assessment will increase from 28.9% to 35% by May 2026.
This interim goal is trending correctly, but off track.
At the start of the school year, second-grade students were performing at 28.3% proficiency on the assessment. At the time of the January benchmark testing, they were performing at 30.3% proficiency. While encouraging, they are not currently expected to achieve 35% proficiency by May 2026.
Interim Goal #1.3
The percentage of students performing at minimally proficient on the second-grade STAR Reading Assessment will decrease from 59.7% to 45% by May 2026.
This interim goal is trending correctly, but off track.
At the start of the school year, second-grade students were performing at 63.4% minimal proficiency on the assessment. At the time of the December benchmark testing, they showed improvement to 62.0% minimal proficiency. While encouraging, they are not currently expected to achieve the 45% goal set for May 2026.
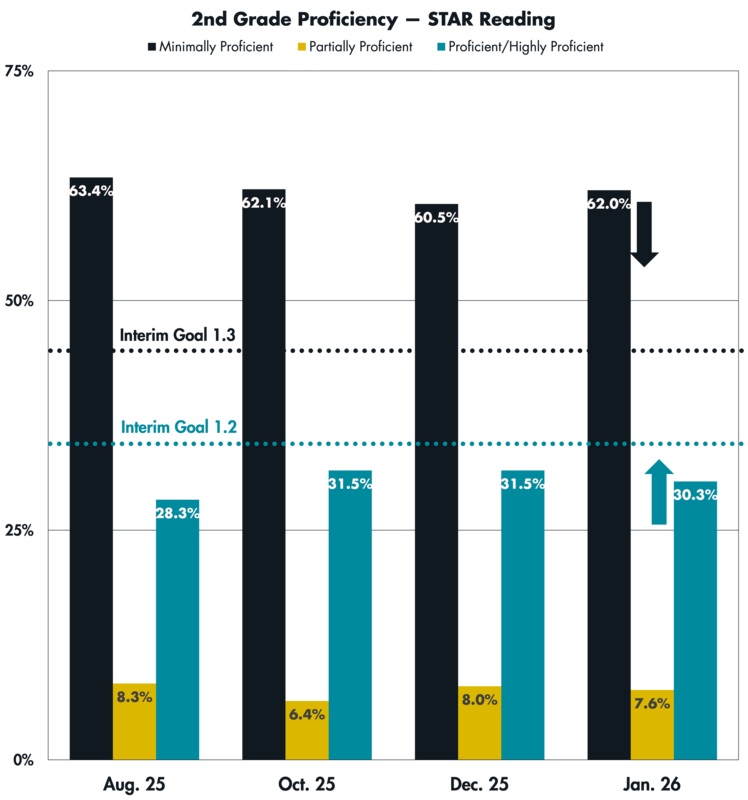
The black arrow indicates our interim goal of reducing minimally proficient students to below the black dotted line, and the teal arrow indicates increasing proficient students to above the teal dotted line.
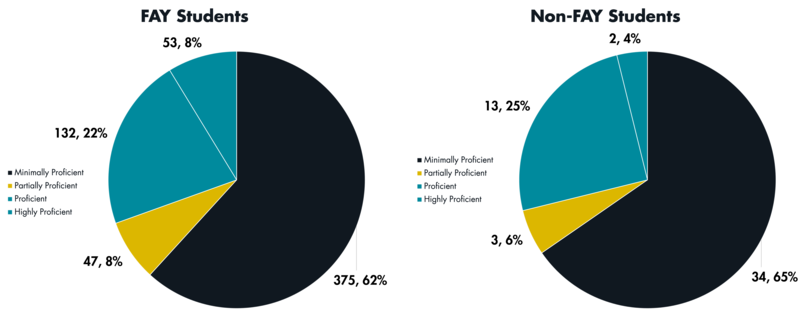
January Full Academic Year Comparison
Input Monitoring
SIPPS Tier 2 Intervention Program
Systematic, explicit decoding instruction for K-12
4 differentiated programs, based on diagnostic assessment
Accompanied by decodable texts
Currently implemented in 9 schools for Tier 2 intervention
Ashlock Learning Walks and Implementation
Time in Text | Text Structures
Phonics Decoding Strategy | Informational Text Structure
Clear Teacher and Coach Monitoring "Check-Offs":
TC 3 – Word Reading
TC 5 – Phoneme Blending Instruction
TC 6 – Phoneme Segmentation
TC 8 – Sound-by-Sound Blending
TC 10 – Spelling-Focused Word Reading (Single and Multi-Syllable)
TC 11 – Reading Pre-Decodable Text
TC 14 – Reading Text-Advanced
TC A – Student Response
Empathy Interviews
Empathy interviews are structured conversations with students and teachers designed to deeply understand their experiences, needs, and perspectives in order to inform more responsive and effective teaching and learning decisions.
February Site Visits: Reading-Focused Interviews
14 Teachers, Kinder–8th grade and ESS Self-Contained
13 Students, 3rd–8th grade
Teacher Interviews
Understanding Daily Practice
Walk me through how you prepare...
Exploring the Gap
Tell me about a time it just didn't work out...
Professional Learning & Support
What kinds of support, tools, or resources would make it easier...?
Student Experience
What do you notice about their engagement...?
Student Interviews
Daily Learning Experience
Help me picture your class...
Engagement and Support
When you get stuck, what usually helps you...?
Connection to Curriculum
Are there any books, activities or online tools that help you learn?
Student Voice on Learning
What would your ideal class look like…?