At the March Governing Board meeting, the Board received an update on progress toward achieving Academic Goal #2 and interim goals 2.1 and 2.2.
Fifth Grade AASA Math Proficiency
Academic Goal #2
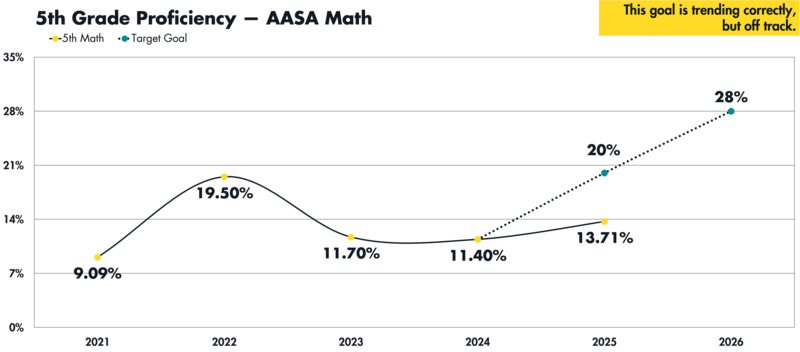
The percent of fifth-grade students who score at Proficiency or higher on AASA Math will increase from 11% in Aug. 2023 to 45% by Aug. 2028.
This goal is trending correctly, but off track.
Fifth graders showed a modest increase in proficiency from the previous fifth-grade cohort on AASA Math. This goal is still off-track according to AASA and Star Math results, even with slight improvements in math proficiency in grades 3-5.
Third Grade STAR Math Proficiency
August to March Progress Monitoring (Full Academic Year only) By School
School | Students Tested | Minimally Proficient | Percent Change | Partially Proficient | Combined Proficiency | Percent Change |
|---|---|---|---|---|---|---|
Bernard Black | 55 | 58.2% | ↓ 10.9 | 23.6% | 18.2% | ↑ 5.4 |
C.C. Campbell | 34 | 47.1% | ↓ 5.8 | 17.6% | 35.2% | ↑ 2.8 |
C.E. Chavez | 49 | 61.2% | ↓ 2.1 | 18.4% | 20.4% | ↑ 2.1 |
E.V. Pastor | 45 | 40.0% | ↑ 4.4 | 28.9% | 31.2% | ↓ 6.6 |
Ignacio Conchos | 56 | 60.7% | ↑ 14.3 | 14.3% | 25.0% | ↑ 3.6 |
Irene Lopez | 38 | 63.2% | ↑ 21.1 | 21.2% | 15.8% | ↓ 5.2 |
J.F. Kennedy | 79 | 53.2% | ↑ 10.2 | 25.3% | 21.5% | ↓ 8.9 |
P.L. Julian | 44 | 40.9% | ↓ 13.6 | 25.0% | 34.1% | ↑ 6.7 |
Southwest | 36 | 44.4% | ↓ 11.2 | 25.0% | 30.5% | ↑ 2.7 |
Sunland | 79 | 65.8% | ↓ 1.3 | 19.0% | 15.2% | ↓ 3.8 |
T.G. Barr | 24 | 54.2% | 0.0 | 29.2% | 16.7% | ↓ 8.3 |
Valley View | 61 | 50.8% | ↓ 1.7 | 29.5% | 19.7% | ↓ 14.8 |
District | 600 | 54.3% | ↑ 0.8 | 22.8% | 22.8% | ↓ 2.5 |
Third Grade STAR Math Proficiency
Interim Goal #2.1
The percentage of students performing at Proficiency or Higher on the third-grade STAR Math Assessment will increase from 29.8% to 36% by May 2026.
This interim goal is off track.
At the start of the school year, third-grade students were performing at 24.5% proficiency on the assessment. At the time of the October benchmark testing, they were performing at 23.4% proficiency. They are not currently expected to achieve the 36% goal set for May 2026.
Interim Goal #2.2
The percentage of students performing at minimally proficient on the third-grade STAR Math Assessment will decrease from 48.8% to 40% by May 2026.
This interim goal is off track.
At the start of the school year, third-grade students were performing at 55.3% minimal proficiency on the assessment. At the time of the October benchmark testing, they showed improvement to 53.5% minimal proficiency. While encouraging, they are not currently expected to achieve the 40% goal set for May 2026.
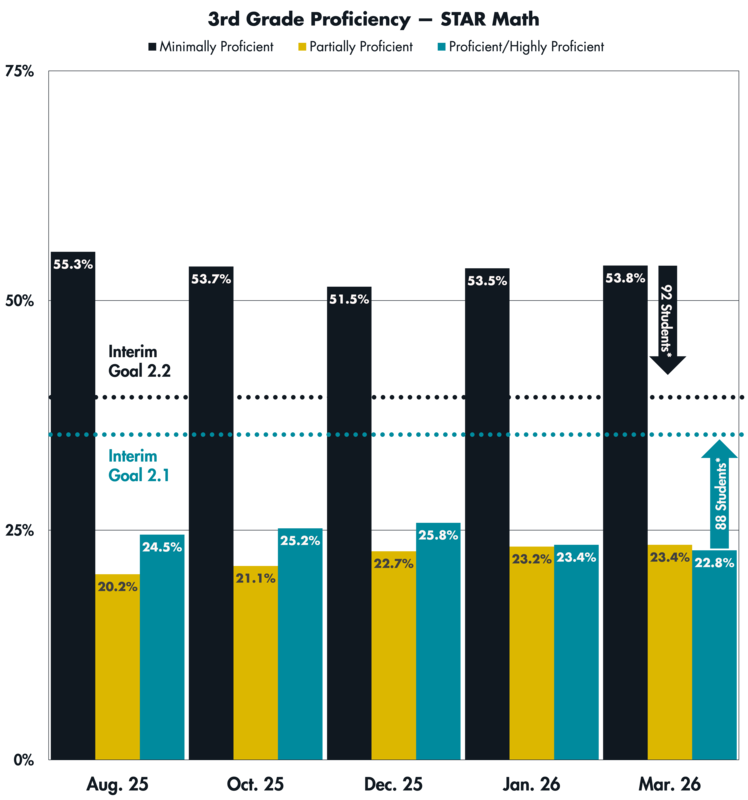
The teal arrow indicates our interim goal of reducing minimally proficient students to below the teal dotted line, and the black arrow indicates increasing proficient students to above the black dotted line.
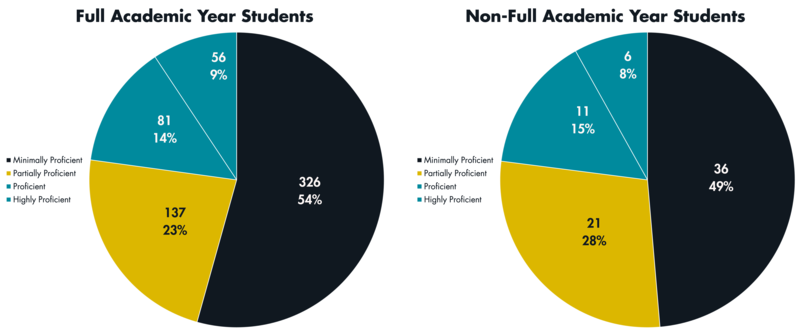
Full Academic Year Comparison
Key Inputs
Targeted Tutoring Outcomes
Students Receiving Tutoring
Grade | Students | Dec. Avg. Scale Score | Mar. Avg. Scale Score | Tutoring Change | Dec. Proficiency | Mar. Proficiency | Proficiency Change | Count of Change |
|---|---|---|---|---|---|---|---|---|
3rd | 72 | 919.5 | 935.9 | +16.4 | 6.9% | 19.4% | 12.5% | 9 |
5th | 59 | 1011.6 | 1023.6 | +11.9 | 13.6% | 22% | 8.5% | 5 |
6th | 54 | 1039.4 | 1060.7 | +21.3 | 0% | 29.6% | 29.6% | 16 |
8th | 36 | 1074.2 | 1088.6 | +14.4 | 2.8% | 19.4% | 16.7% | 6 |
Students Not Receiving Tutoring
Grade | Students | Dec. Avg. Scale Score | Mar. Avg. Scale Score | Tutoring Change | Dec. Proficiency | Mar. Proficiency | Proficiency Change | Count of Change |
|---|---|---|---|---|---|---|---|---|
3rd | 555 | 902.7 | 918.8 | +16.1 | 29.2% | 23.6% | -5.6% | 31 |
5th | 547 | 973.9 | 981.3 | +7.4 | 26.3% | 20.8% | -5.5% | 30 |
6th | 692 | 987.9 | 1008.9 | +21 | 14% | 13.2% | -0.9% | 6 |
8th | 502 | 1027.8 | 1037.3 | +9.4 | 10% | 10.6% | 0.6% | 3 |
Weekly Data Meetings
During data meetings, the protocol leads teams through using their exemplar to analyze student work and identify learning gaps. Once the gap has been identified and named, teams determine the best approach to reteaching to close it. We have seen exponential growth at many schools in implementing this protocol. We believe this process is powerful professional development for teachers, especially in building their conceptual understanding of the standard and what supports students need to reach mastery.
Data Trackers
Data trackers are reviewed at least monthly by the Teaching and Learning Division leadership. Feedback has focused on being specific in naming the learning gap and on including details in the reteach strategy.
National Council of Teachers of Mathematics Conference
In March, members of our Teaching and Learning Division attended the National Council of Teachers of Mathematics Spring Conference. The team focused their conference attendance on the following topics, based on needs they had previously identified.
Math intervention resources and strategies
Early numeracy development
Equity and cultural responsiveness in mathematics
Implementation of mathematics improvement plans
Lavinia Group Math Consultant
We are in the middle of our work with the Lavinia Group for evaluating our math program and developing a district math improvement plan. During the month of April, our consultant conducted three days of site visits to see math instruction in action and to meet with focus groups to understand perspectives of the current math program and supports. His work has now transitioned into:
Analysis of student data, Tier 1 curricular resources and curriculum maps/unit plans
Synthesis of qualitative and quantitative data
Drafting of recommendations and implementation plan
T&L team support and development
Work will be completed by the end of June, with a board presentation planned for the June study session.